5 Resources to Create Killer Infographics
Creating Infographics is not exactly hard, but it can sometimes be a pain if you have to do everything manually. That is why people create tools to help others build better Infographics. It allows you to apply highly graphical techniques without the pain of having to do all of the detailing manually by yourself.
1 – Easel.ly
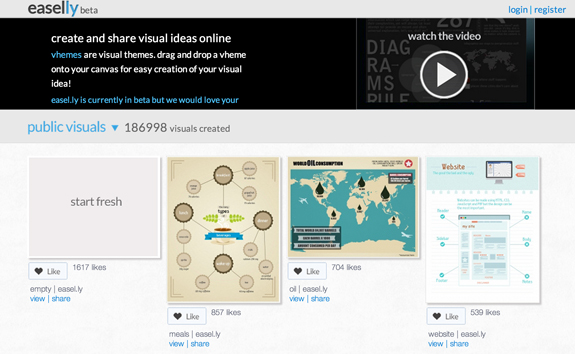
This is an Infographic builder that you can use online. It is free too, which is always nice. This is a very strong platform/browser based builder where you can customize your Infographic in a very detailed manner. There are very few Infographics created with this tool that look similar to others. The tool allows you to be quite creative so that you can really express your design finesse and expertise via your Infographic.
It is good for telling timeline stories, but is also good for adding raw data in a very readable fashion. It allows you to enter raw data in an easy to read manner, or turn it into charts and visualizations so that they are easier to understand. It is already a very popular tool and the design/customization capabilities it has, has helped to develop some very good Infographics.
2 – Visual.ly
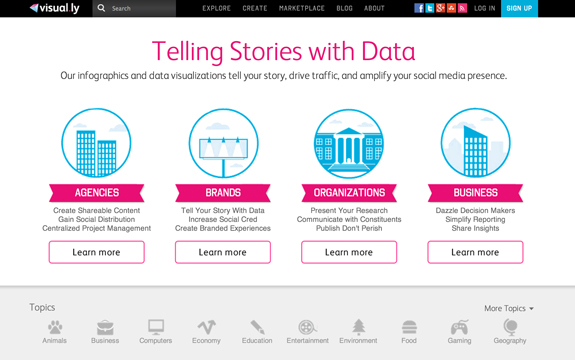
This little tool prides itself on showing you more than a drunk chick at a swimsuit party. They offer you a lot of free tools that you can use on your Infographic as you build it. You are given a work space in the middle of the screen, and your tools are laid out around it. You are then able to make up your Infographic by dragging and dropping tools or elements onto the workspace.
For example, you can drag and drop the writing tool onto the screen and then manipulate the text after you have written it so that it fits into your design. This tool is also good for making highly attractive and graphical. The tools are free to use and is revered by a lot of people for how easily it allows you to make fun Infographics. There is also a marketplace where you can sell your Infographics or talk with other artists about their projects.
3 – Gizmo
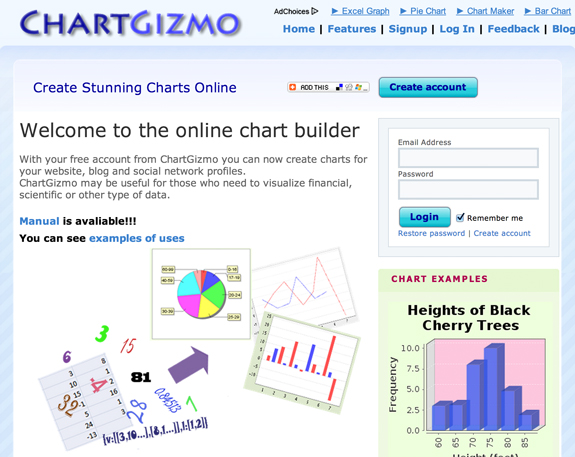
This is a tool that allows you to create fun and graphically pleasing charts. All you need to do is plug your information into the tool and it will create the chart of your choosing. You can pick the type of chart that you want to preview and then alter it after the fact so that it fits your Infographic. There is a free version that you can use, or you can try the paid version that gives you lots of different functions and tools to further change and optimize your chart.
The free version should be fine for your Infographic, as many of the tools and functions are all you need for a basic/intermediate chart. However, if you have to create charts on a regular basis for your work or for multiple Infographics, then you could do worse than paying for the paid version. This will help to stop your Infographics from looking repetitive or overly bland.
4 – Piktochart
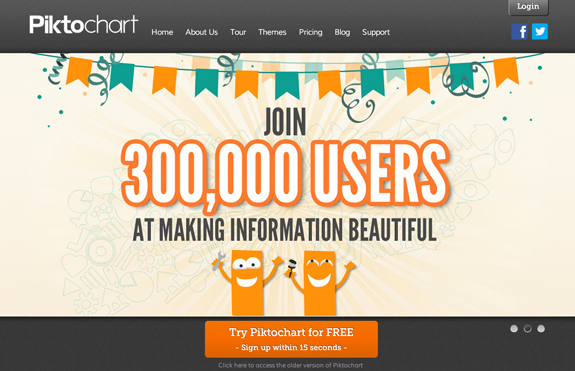
This is actually a tool that helps you to design your Infographic in a CMS fashion (CMS means content management system). You may also hear some people refer to this form of CMS as “WYSIWYG”, which means, “What you see is what you get”.
All you need to do is pick one of the six free themes and then start laying your graphical elements onto it. You pick the things you like from the menus and then place them on the theme. You can manipulate and edit the things you add, whilst being able to see what your Infographic will look like without needing to preview it. It uses a drag and drop system, and you can upgrade the entire process if you use the paid version. The paid version will give you more themes and more menu options to choose from.
5 – iCharts
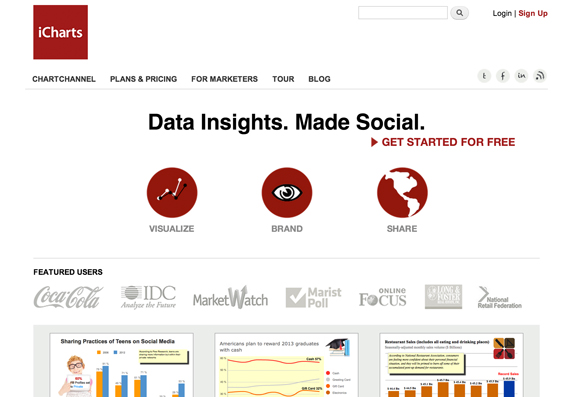
This is a great tool for creating some very nice charts online. It has a number of tools that make chart creation a little more customized and personalized. It is good because it allows you to load Excel spreadsheets onto it so that you can create very detailed and large charts. You can use Google Drive with it, zoom in, pan, and any new information that you enter will be automatically updated on your charts.
There are also tools for making your Infographics a little more search engine friendly, and there is a nice little public sharing function too. It also comes with analytics to help you judge the success of your charts/Infographics.
Related Resources:


Cool thanks for these Links!