25 Best Chart and Graph Design Ideas
Have you ever presented a corporate presentation or published a write-up related to some economical or statistical topic? Yes, then you must be very much aware of the importance to choose good graph design and chart design. You must be having a very good idea that how does graph design affect the over all success of your presentation or that of your application design. Graph design and chart design have a great impact on the success of any presentation or application where the subject has got much to do with the graphical representation of the data. There are many presentation where the entire discussion is based on the graphs and charts hence there is much more to do with the graph designs and design charts. Whenever someone has to design graph the first step is to find some appealing graph designs which possess the element of attractiveness, aesthetic appeal and visibility and also to some extent the element of self explanation through colors.
There are great number of graph templates and design available on internet however to choose the best for your work is the main job. You must be very well aware and careful before selecting any design as this is the main view which will be presented to your viewers and this is the main content of your work which will either get your work approved or disapproved by the viewers. Hence it is not necessary to have some very colorful graphs all the time rather you should select the design which best matches your topic and the type of information you would like to share with your viewers.
However, if you are looking for some great ideas to design graph or to design charts , so you have reached the very right place where we will be sharing some great ideas to design graphs and charts which will add great effectiveness in terms of representation of data and the attraction for the viewers. These designs have been very much used by our team in their data presentations and they have received a very positive feedback from the audience therefore we thought why not to share the same with out great audience as well.
Have a look on these fantastic designs and do share your feedback with us.

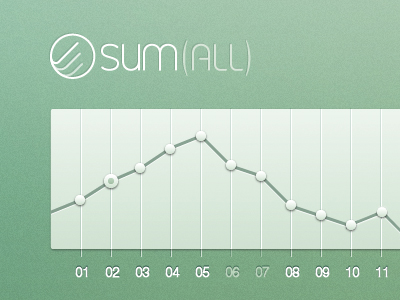
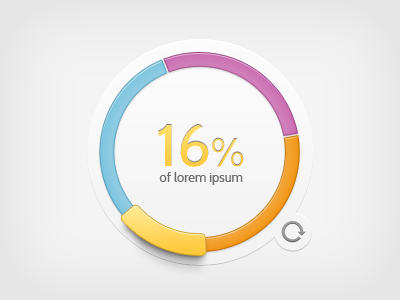
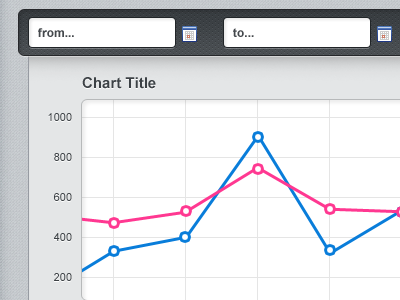
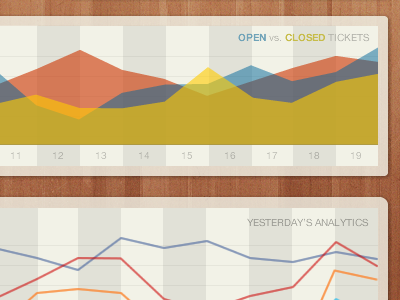
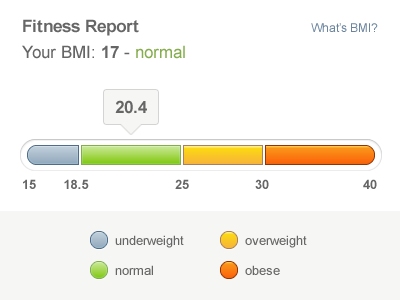
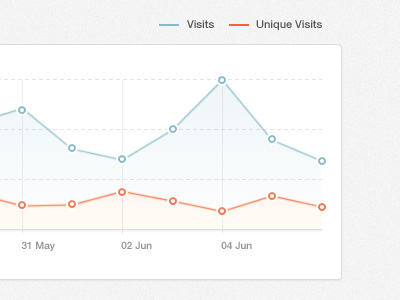
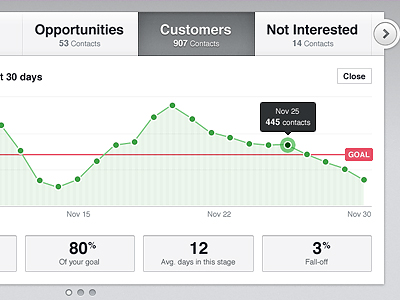
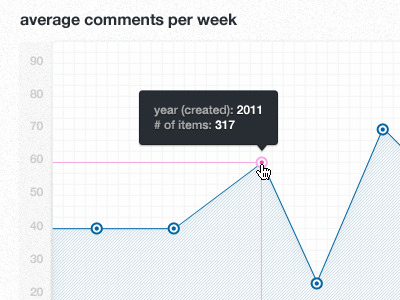
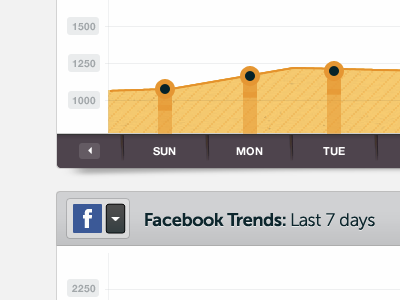
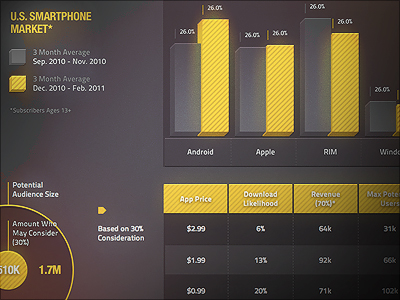
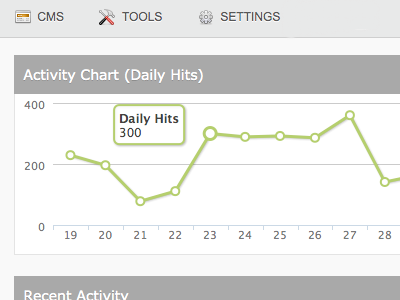
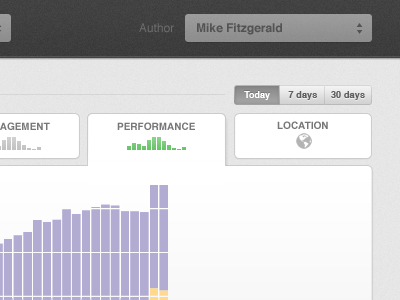
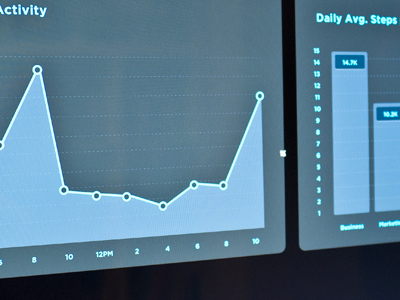
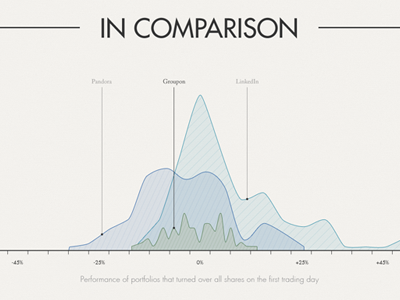
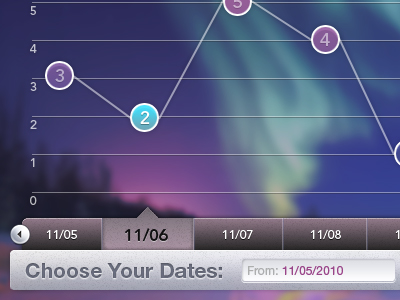
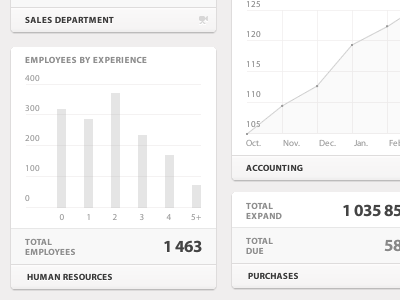
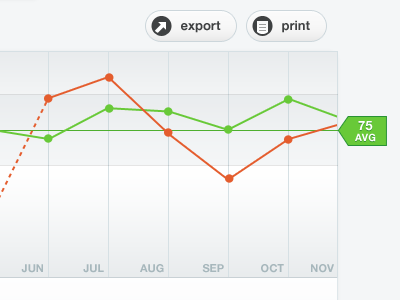
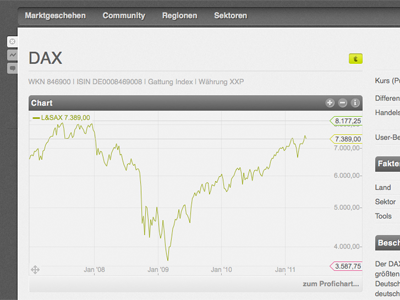
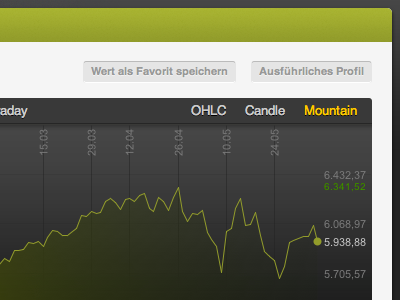
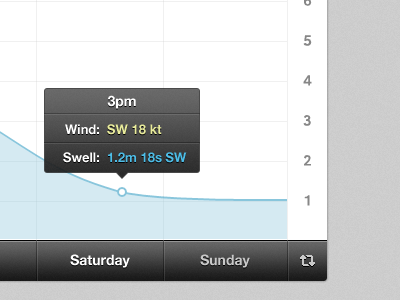
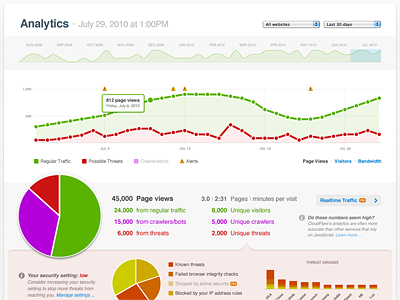
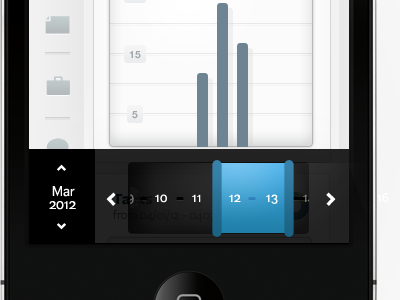
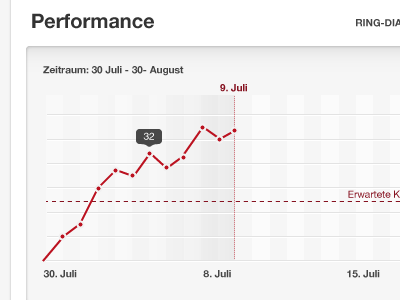
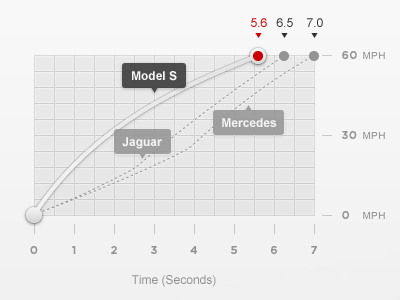
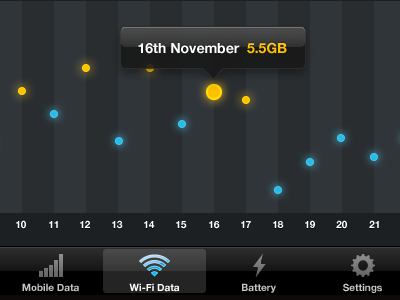




Cheers for sharing these examples of charts and graphs, they are all really nice and really effective. I think these work so well because they are really simple and clean so that they can easily be seen and understood. Also looking at some of these examples, they have used a really nice and clean user interface so that it gives across a professional feel. Once again thanks, I will defiantly be looking back at these is I ever get a project where I would need to design something similar to these.